I once had an awesome client who ordered an 8.5” x 11” infographic. As a designer, I am always super excited by infographic projects because they allow for a ton of creativity and our clients are always surprised by how well they perform.
The client wanted something that was science-fiction inspired with a focus on technology. Anyone who knows me knows that this is the best-case scenario, especially since I was deep into reading the Hitchhiker’s Guide to the Galaxy series by Douglas Adams at the time.
I created some style frames (which are like a mood board but specific to the client’s project) and joined a meeting with the client to discuss them.
Our client excitedly presented us with the text content for the infographic. At this point, my producer and I looked at each other and realized we may have gotten ahead of ourselves. The client had created an 8-page long word document that included other infographics as content within this infographic.
This was apparently the reduced and revised version.
We reminded our client that this was meant to be an 8.5” x 11” infographic, and it wasn’t really possible to fit 8 pages of content onto one page. It was at this point we realized that the client didn’t understand what an infographic should look like or what it would be used for.
Honestly, they tried. And they certainly aren’t the first people to want to get in on the infographic action but don’t quite understand what it takes and how to prep for one.
Had I taken the time to present a client with a template that makes it easy to define what the purpose of the infographic was and what it needed to contain, the process would have gone much smoother.
And that's exactly what I've done for you here so that your next graphic design project goes off without a hitch.
What is an Infographic?
An infographic is a graphic visual aid used to convey information in an easy to understand way. They use a combination of imagery and language to make a complicated concept more digestible.
Not only do infographics make identifying trends and recognizing patterns easier, but they also inspire much more engagement in the content due to their attention-grabbing appearance.
Most people will skip over large blocks of text without a second thought. In fact, a decades-old study found that nearly 80% of people only scan new pages they come across. But when that same information is made into an infographic, users are far more inclined to stop and read through the eye-catching content.
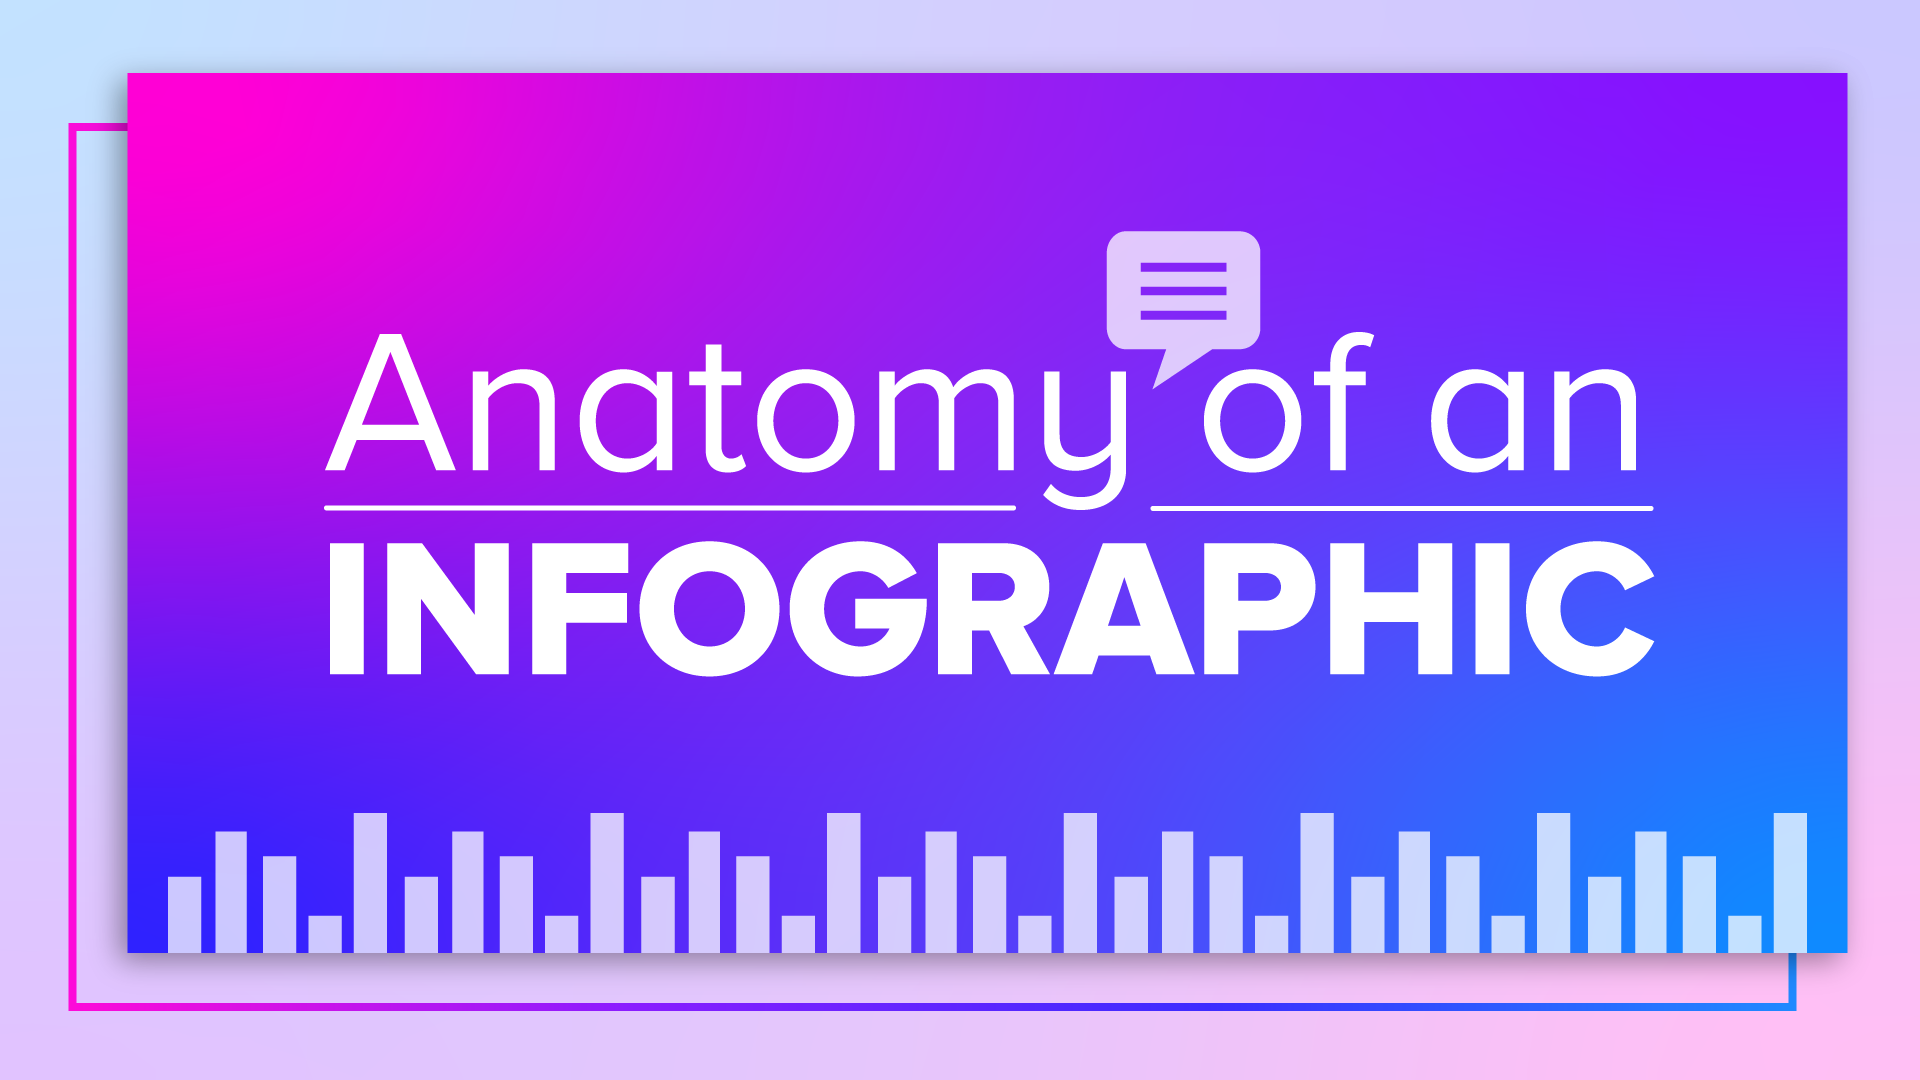
Anatomy of an Infographic
Infographics come in all shapes and sizes. They can be used with graphs and charts to show analytics and data, they can be used with illustrations to show a process, map, or journey, or they can even be used to show how something is made.
Infographics are an extremely flexible medium, but in order for them to be effective, they should follow a basic guideline. There are always exceptions, of course, but in general, infographics thrive on the philosophy that less is more.
The below outline is a guide for a typical 8.5” x 11” infographic intended for either print or digital use. Keep in mind that the size of the infographic can always be adjusted to fit larger needs, but there needs to be enough real estate on the page for both graphics and copy.
CLICK HERE TO DOWNLOAD A FREE INFOGRAPHIC TEMPLATE
Infographic Outline
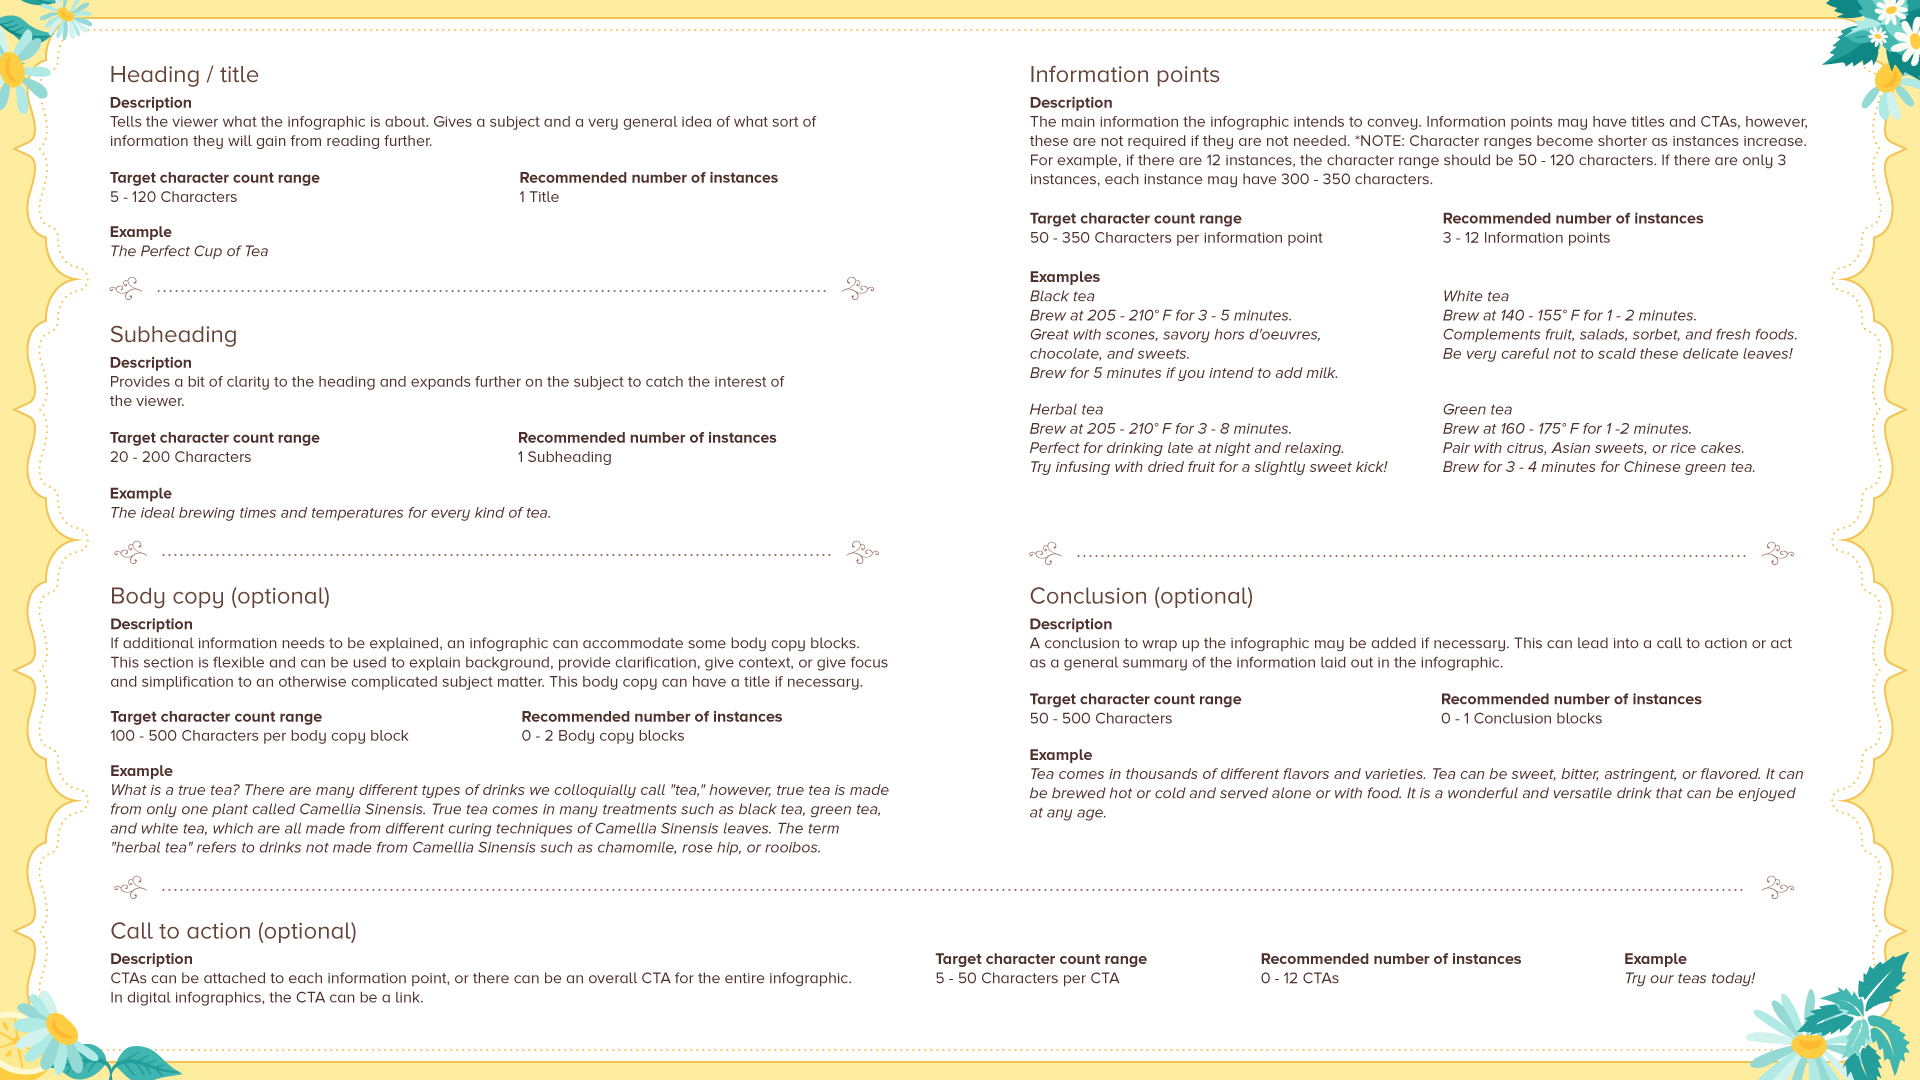
Before deciding on the graphic structure and art style of the infographic, it is important to make an outline of the information you are trying to convey. Refer to the above example infographic and outline guide as you follow the basic steps below to prepare your outline:
- Pick one subject for your infographic.
The infographic should focus on one subject only. It is always better to make a series of multiple infographics than it is to try and squish too many subjects into a single infographic.
The separate infographics will actually be more effective as individuals because they will keep the viewer’s focus and allow the viewer to switch mental gears when they are ready to view the next subject.
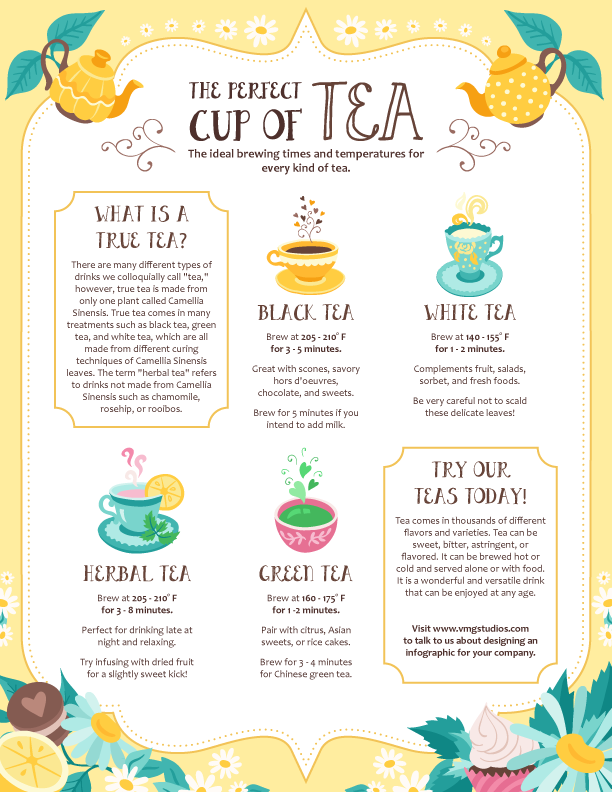
It also allows the infographics to be shared and targeted towards the most relevant audiences. For instance, the example infographic is about tea. Coffee is related but it would be better demonstrated in an infographic of its own.
Multiple infographics can be made into a master infographic by designing them to fit together like a puzzle. In this case, give the master infographic an overarching, broad subject and make sure each individual section has a single, focused subject relating to the master, then proceed to use the outline per each section.
- Choose informative and precise information points
These can be data analysis, graphs, product selling points, steps in a process, sections of a map, bullet points, facts, or instructions. This portion of the infographic is very flexible and can be made to fit any information needs of the infographic as a whole.
In the example infographic, the information points describe different types of tea, how to brew them, and flavors that complement them.
- Decide whether optional pieces of information are necessary or beneficial to the infographic.
Sometimes, there is context, conclusions, or facts that are critical to understanding the information points in the infographic.
In the example, it is important to point out what types of tea our infographic is referring to as well as pointing out that there are more types of teas that our infographic did not mention.
- Decide on a call-to-action (CTA).
If your infographic was created as a marketing tool, you’ll want to guide your intended audience on their next steps. Do you want them to visit your website, store, or point them towards your products? Is there another infographic as part of a series they should view next?
Decide if your infographic requires a CTA (which most do) and plan the information and placement of the CTA in the infographic accordingly.
- Edit and limit your copy.
Having large blocks of text is counterproductive for infographics. You want your graphics to speak for themselves and your copy to clarify and enhance what you are trying to say.
Take a look at the example outline above for character limit suggestions for a basic 8.5” x 11” infographic.
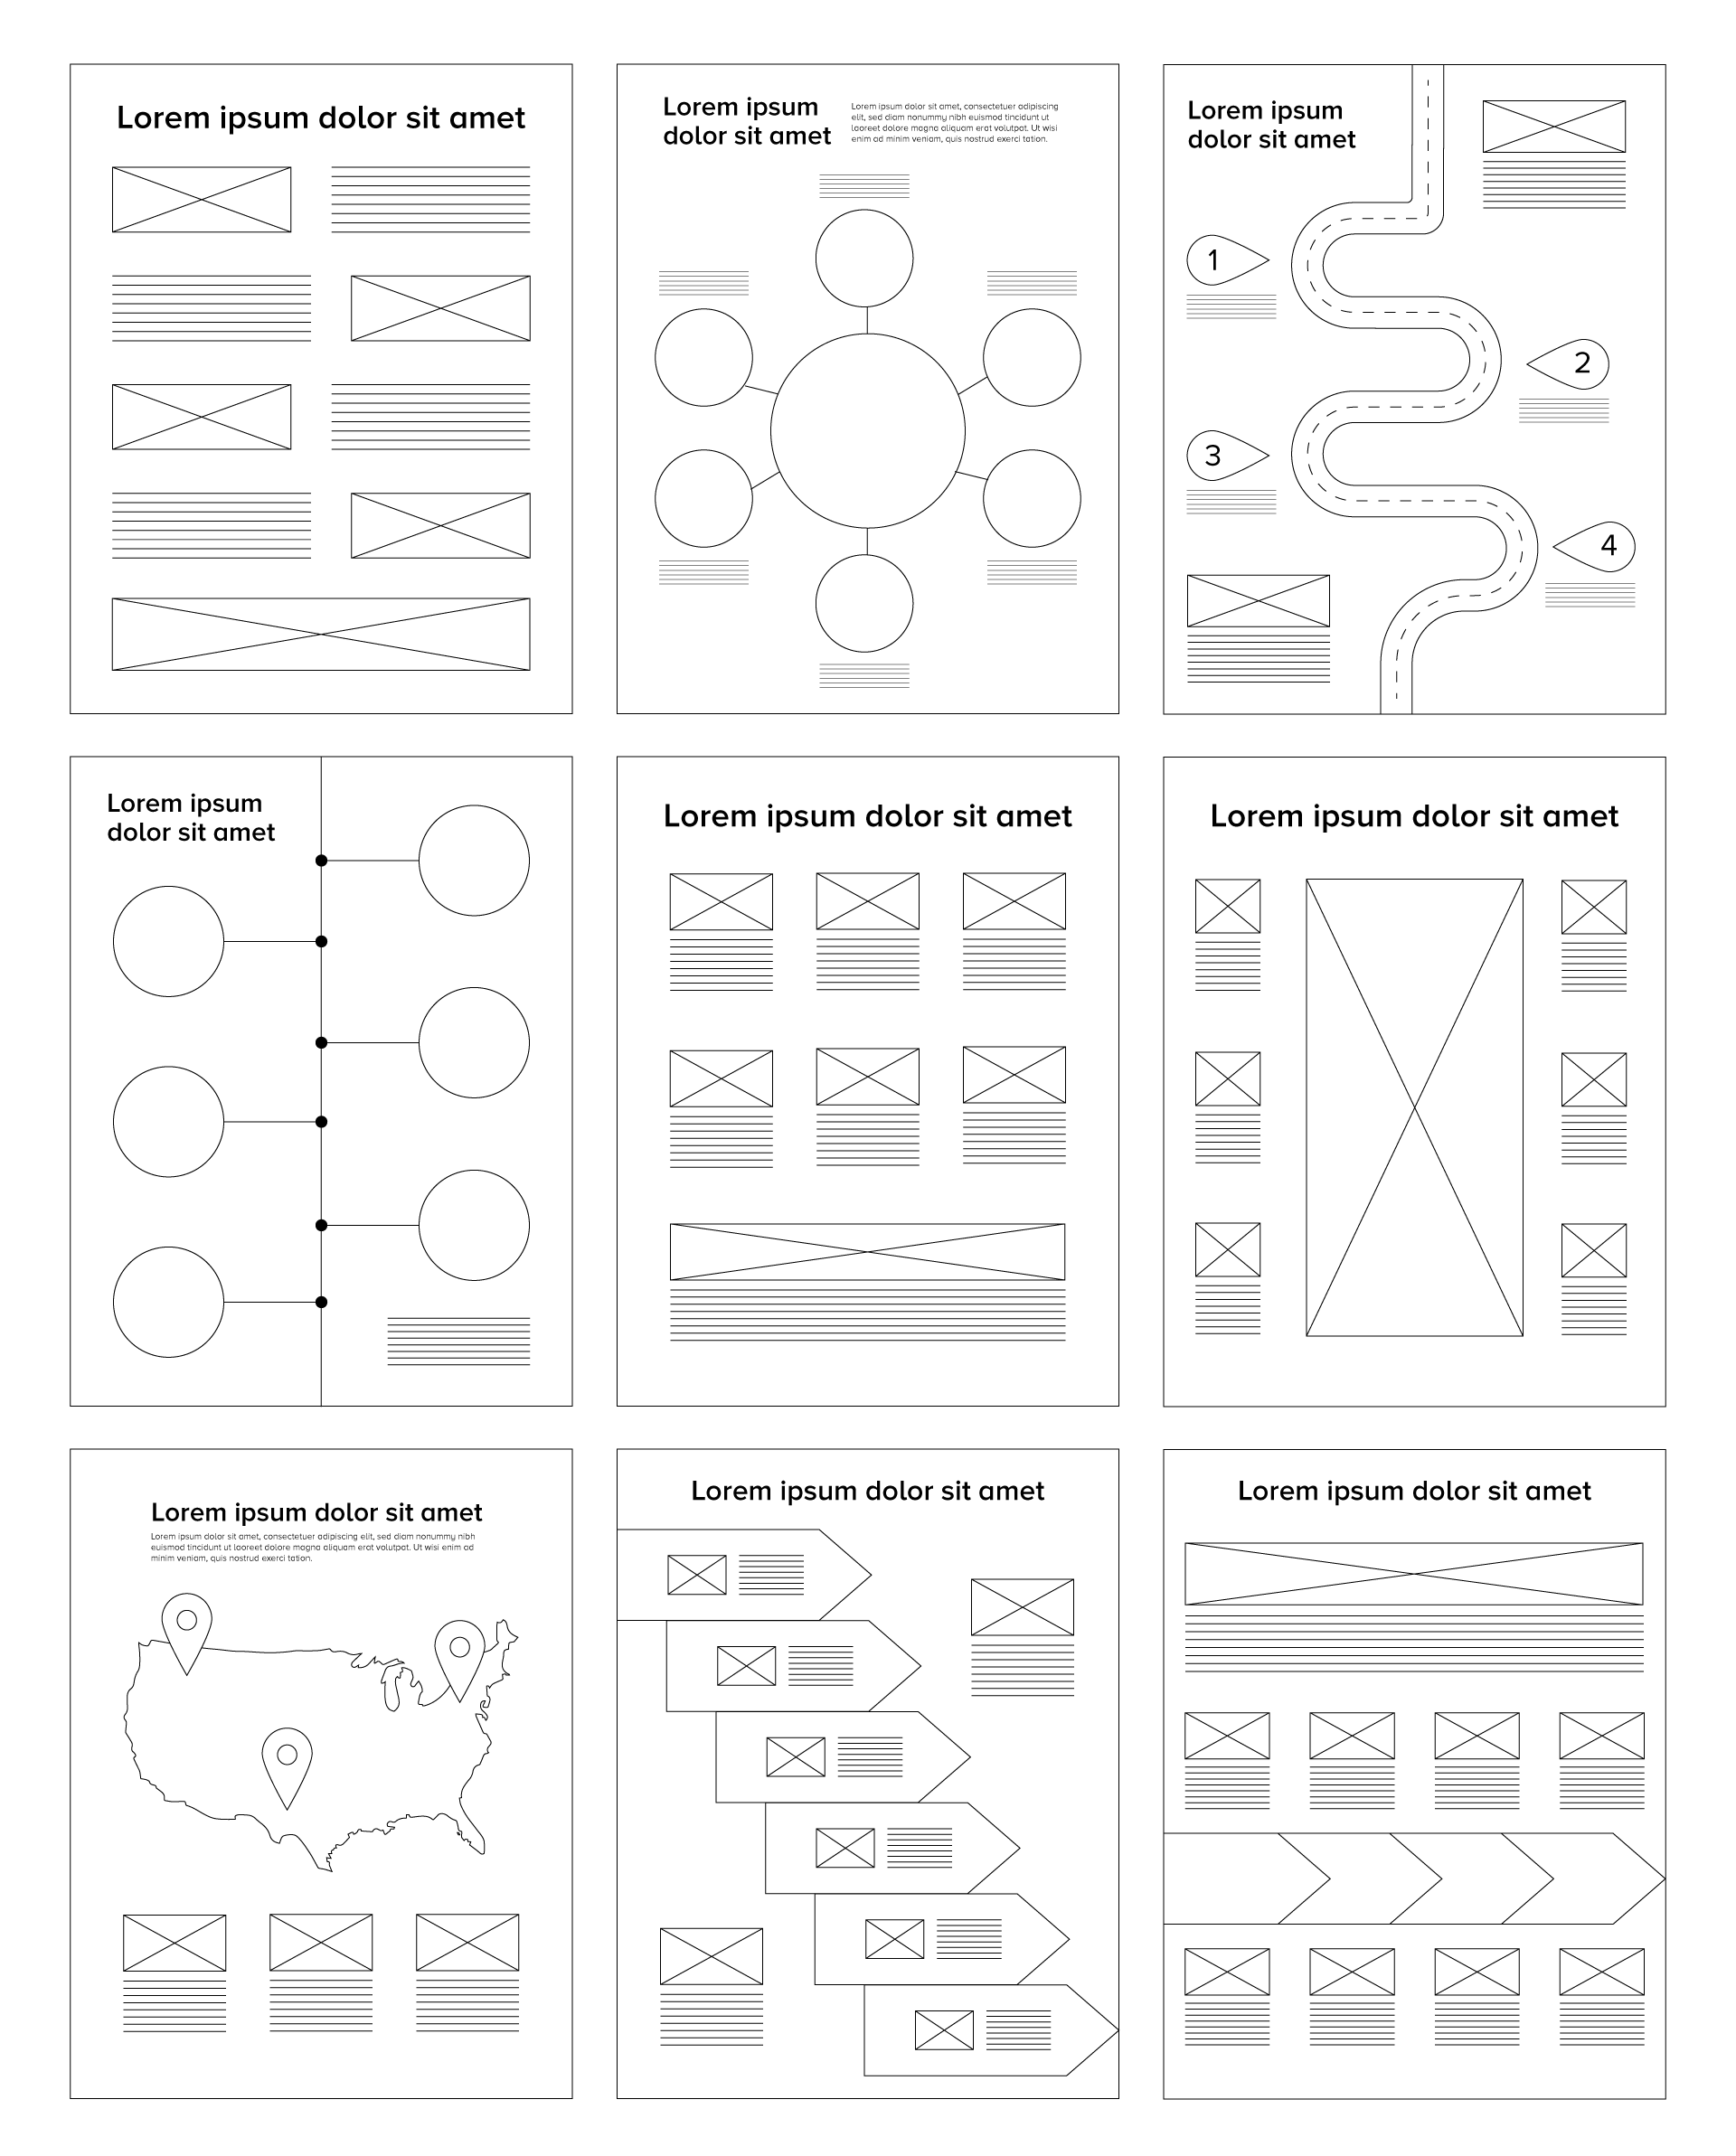
Infographic Structure
Once you have a strong outline created for your infographic, it’s time to think about how the information will be structured artistically.
Effective infographics have meticulously thought out structures that guide the reader’s eyes through the information in a logical and easy-to-read manner.
There are endless types of structures for infographics from basic structures to complex, customized pieces. We have demonstrated some basic structures below, however, your graphic designer is always happy to customize and tweak your infographic’s structure and style to your liking. Remember, the possibilities are endless!
Adding Infographics to Your Marketing Toolkit
Infographics are an effective and interesting communication tool. Making and planning for them can be difficult and frustrating, but following our basic outline and steps simplifies the process and sets up your infographic for success.
Your graphic designer can also give you guidance if you find that your infographic needs to go beyond the scope of a basic outline and structure.
Grab your target audience’s attention with an eye-catching infographic that keeps their focus on your messaging and brand.
Click the image below to download a free infographic template to organize and outline the copy of your own infographic